Tutorial alert Creation
![]()
Version française : Tutoriel_Création_d'une_alerte
1) Go to the Grafana Host
Click or copy-paste this link on a search bar : https://cohabit-capteurs.aquilenet.fr/login
2) Connect
Connect yourself to your Grafana account by using your mail/id and your password.
3) Select the dashboard
Select the dashboard on which you want to set an alert.
Here we select “thermo-bibli”.
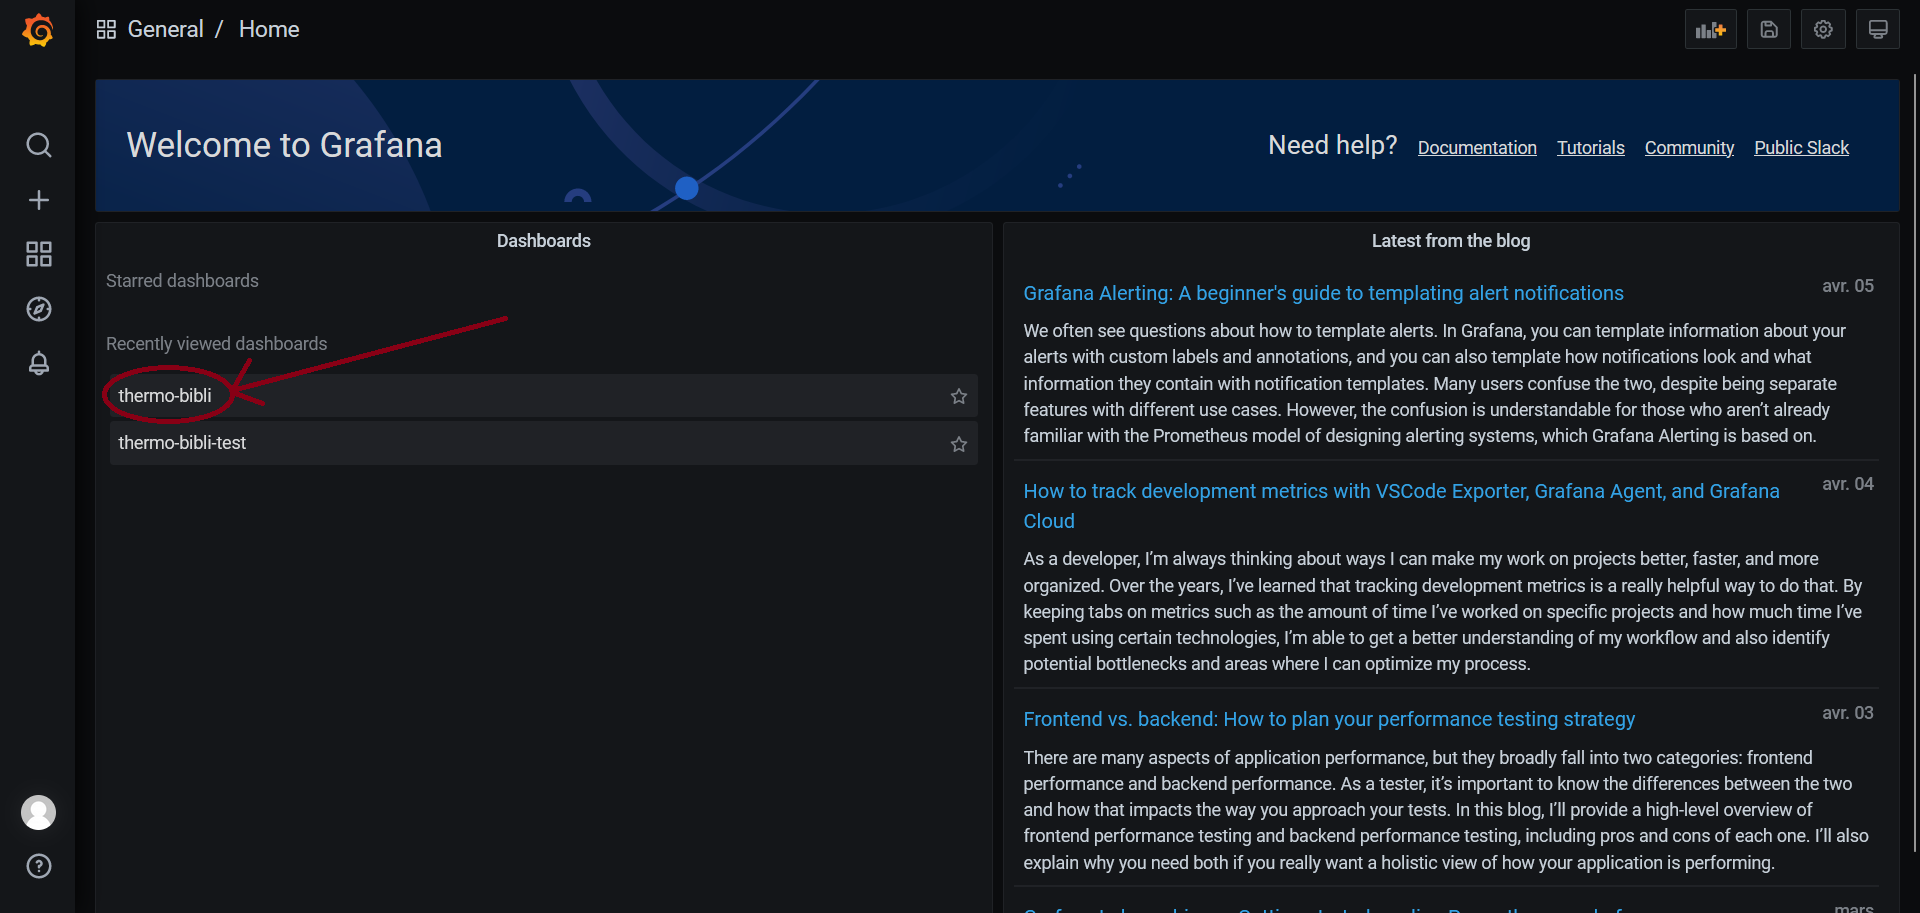
If the dashboard was not seen recently, you can directly find it by clicking on the "General" tab.
4) Select the panel/graph
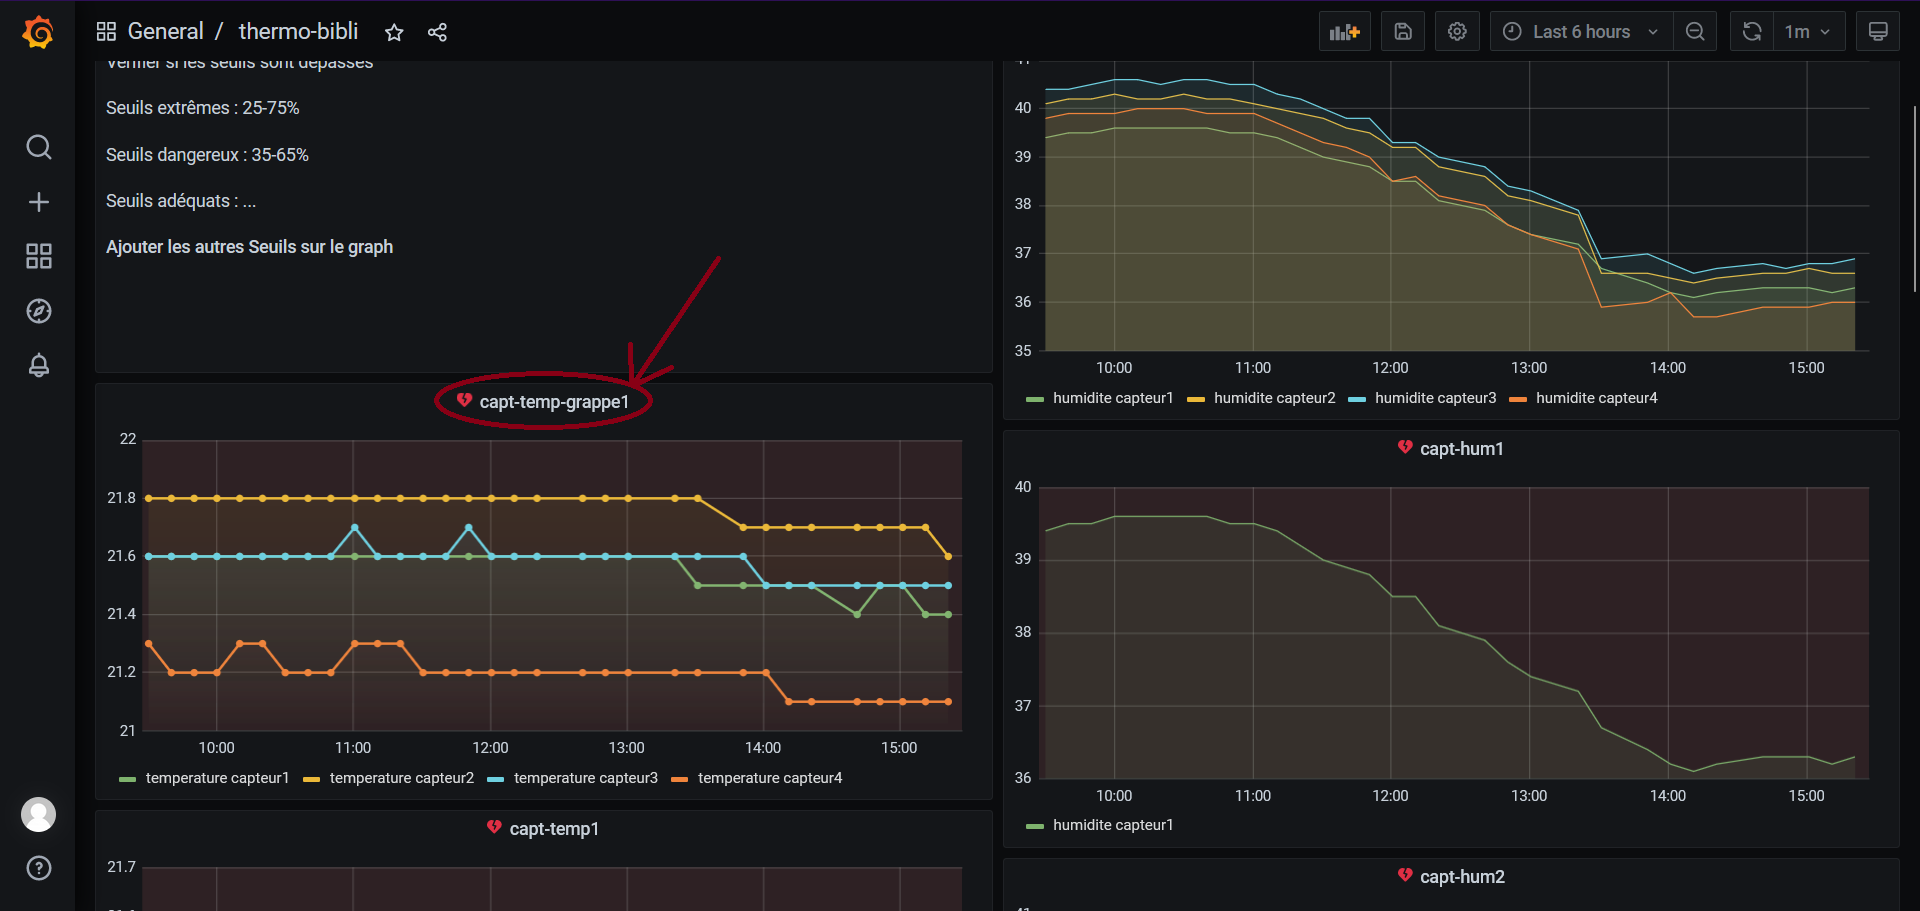
Now, you have different panels depending on the selected dashboard : they allow you to keep the track of the measurements on the graph.
+ Dashboard's Organisation +
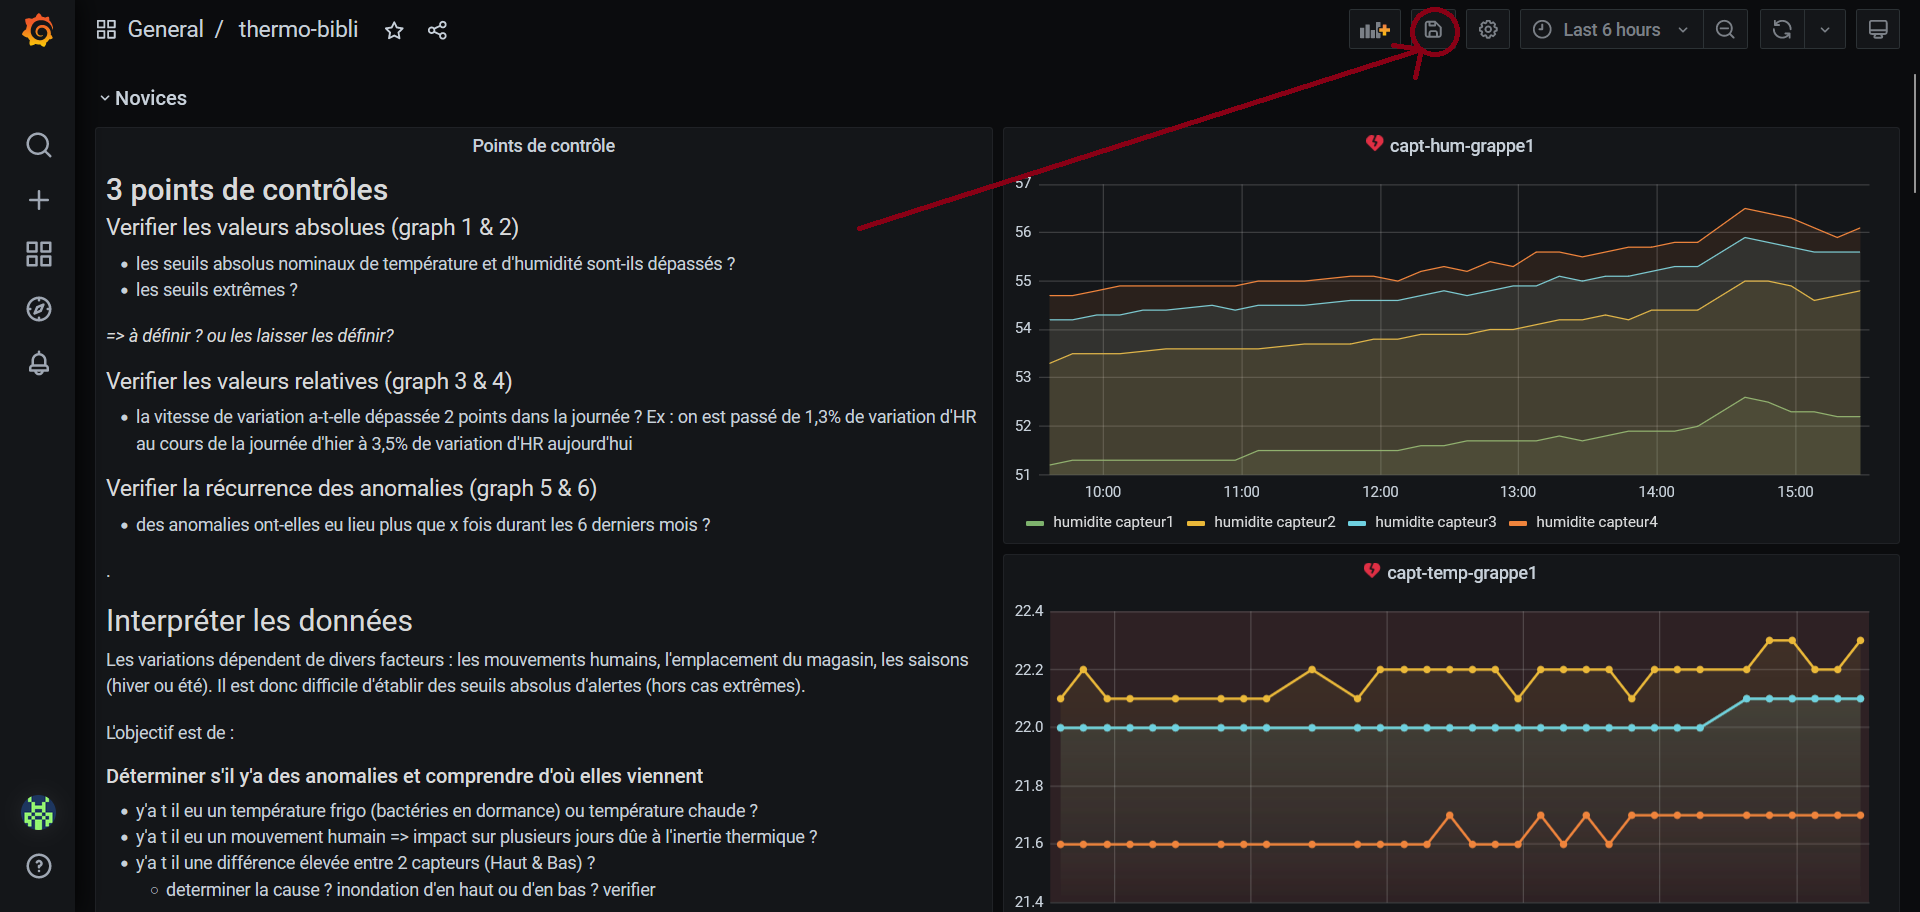
The different graphs on the dashboard display both temperature and humidity measurments.
The two graphs on the first line capt-temp-grappe1 and capt-hum-grappe1 gather data from the 5 sensors of the device .
The graphs below display the respective measurements of each sensor.
Alerts must be set on the two first graphs displaying the data from the 5 sensors.
You should so choose a panel : each graph are named to help you navigate on the page.
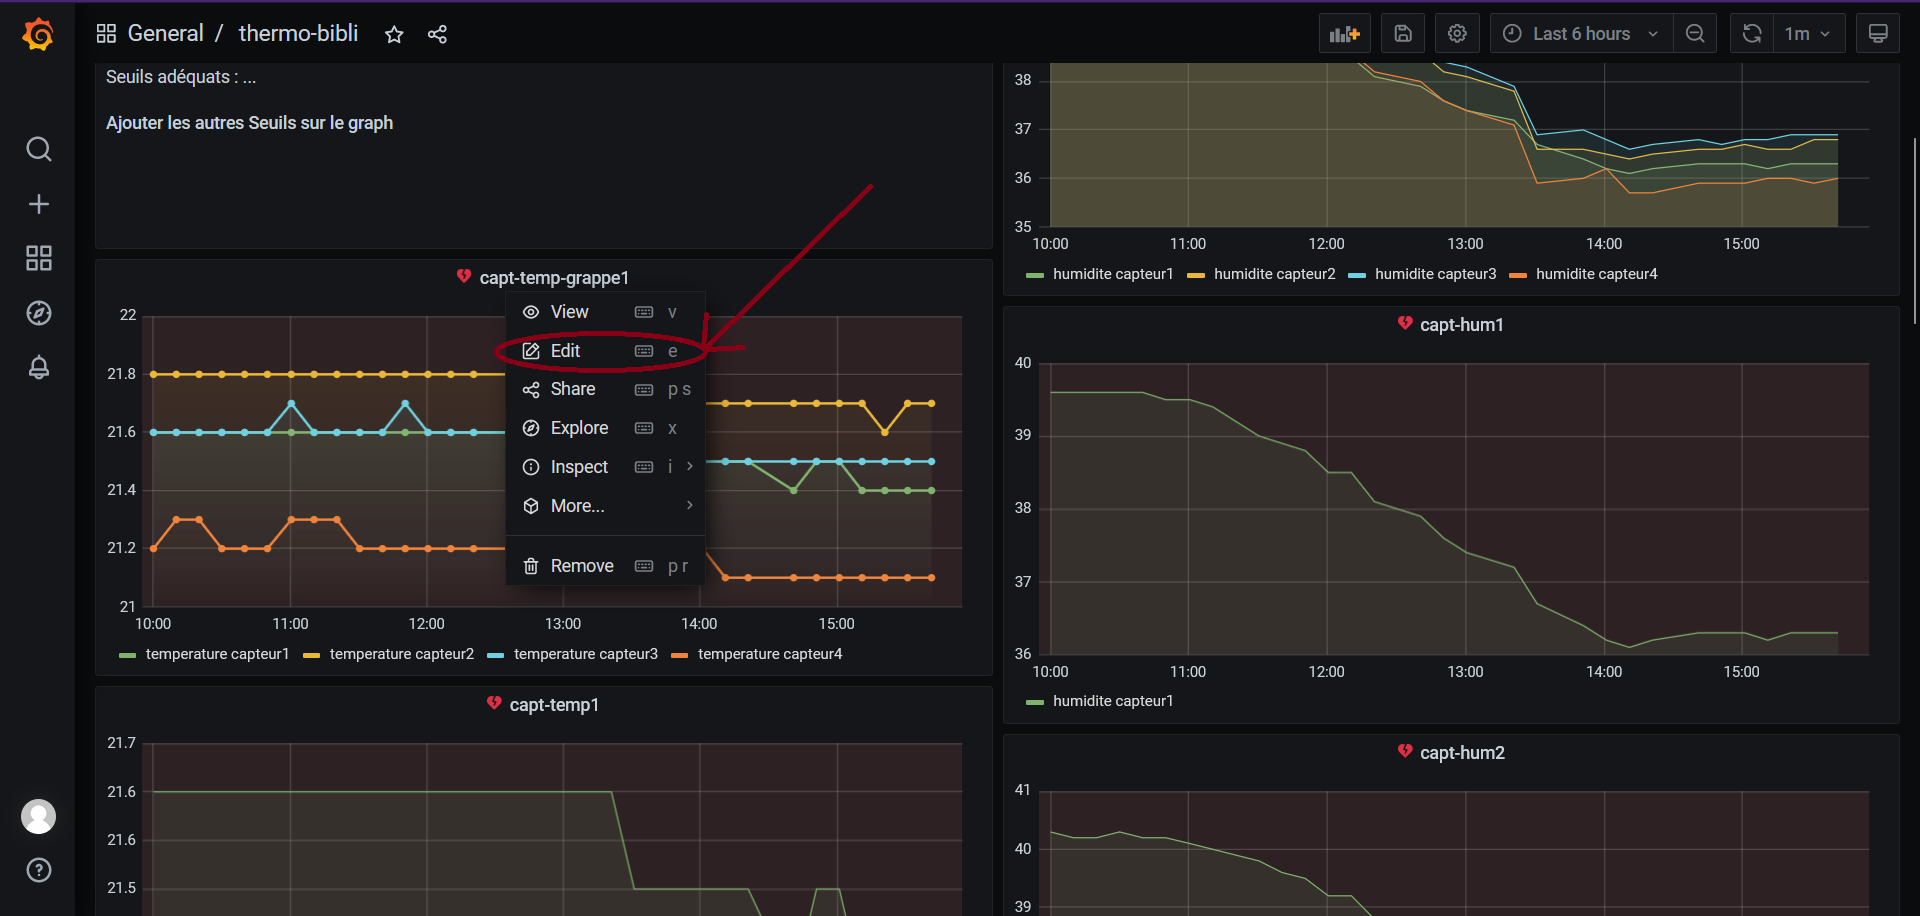
For this example, we are going to set an alert linked with a temperature sensor. (the method is the same for humidity sensors, select the capt-temp-grappe1 by clicking on the graph name)
A drop-down menu appears, select “Edit”.
5) Create a temperature alert
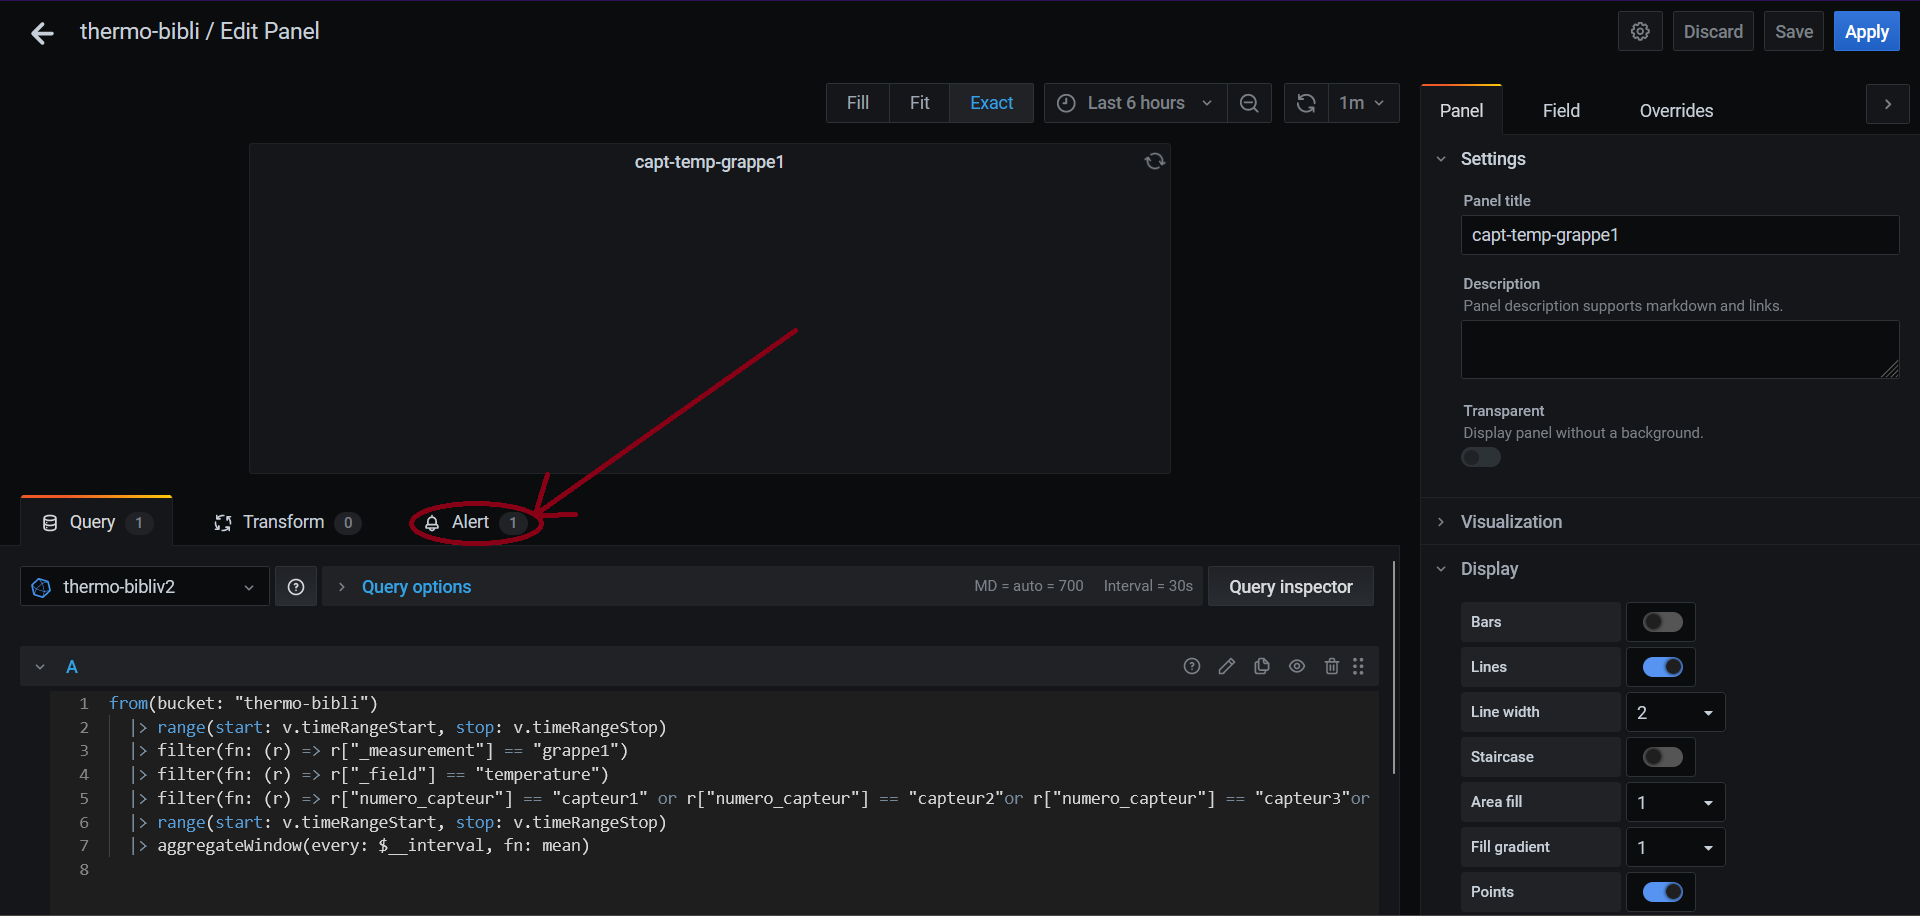
You are now on the panel edit menu, you can do the same steps to access other panels or create and edit alerts.
In the edit menu, below the graph, select "Alert".
Parameters' explanation
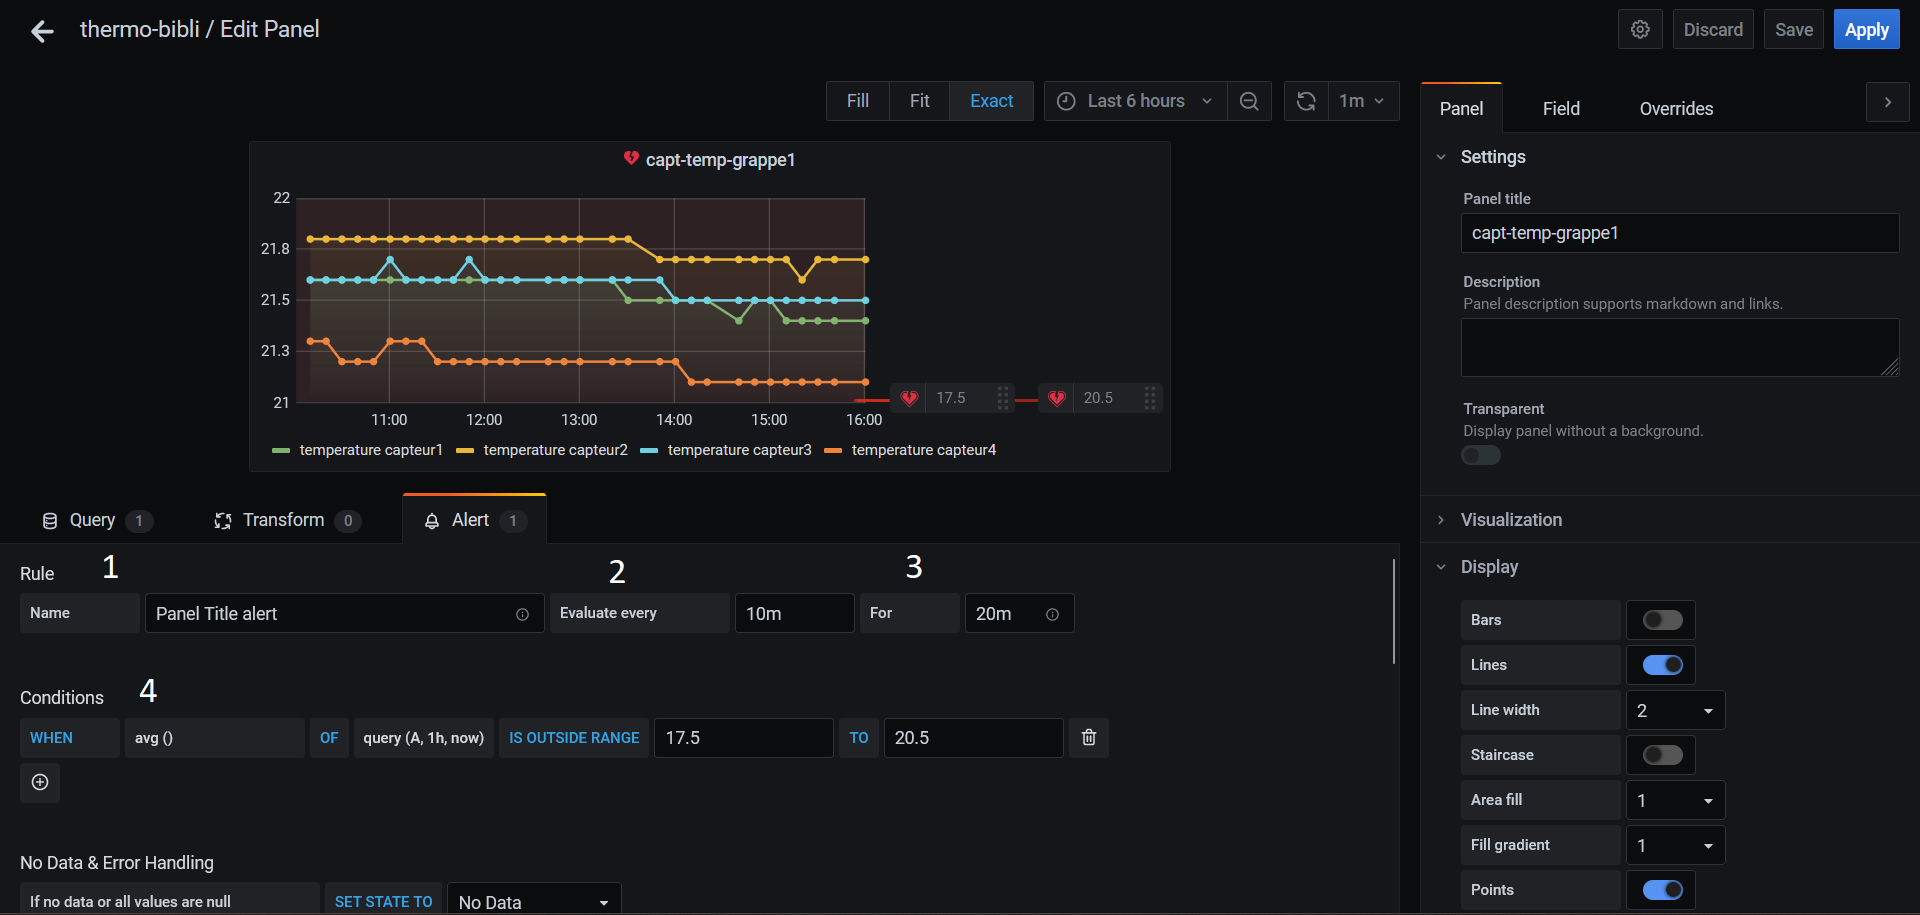
1. “Name”
Enter a descriptive name. The name will be displayed in the “Alert Rules list”.
2. “Evaluate every”
Allow to specify the rate at which the programmer should test the alarm.
It is not necessary to edit these parameters.
3. “For”
Allow to specify how much time the request should exceed the selected threshold before triggering the alert notification.
It is not necessary to edit these parameters.
4. “Conditions”
Allow to select the conditions which will allow to trigger the alert.
For the parameter “WHEN”, select “avg()”
For the parameter “OF”, select “query(A,5m,now)”
Then select “IS OUTSIDE RANGE”, to take into account the temperatures OUTSIDE the selected range.
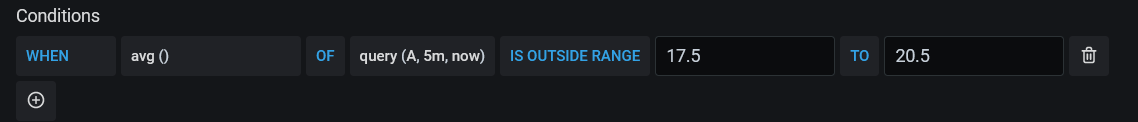
Choose two parameters : for example, to have a temperature range between 17.5°C and 20.5°C we chose the values “17.5” TO “20.5”.
It is also possible to add different conditions for sending the alert.
To create an alert linked with a humidity sensor :
Choose the panel associated with humidity sensors and realise the same process as with the thermal sensors, however enter other values :
For example, for a range between 40% and 60%, enter "40" TO "60".
6) Configure the alert sending
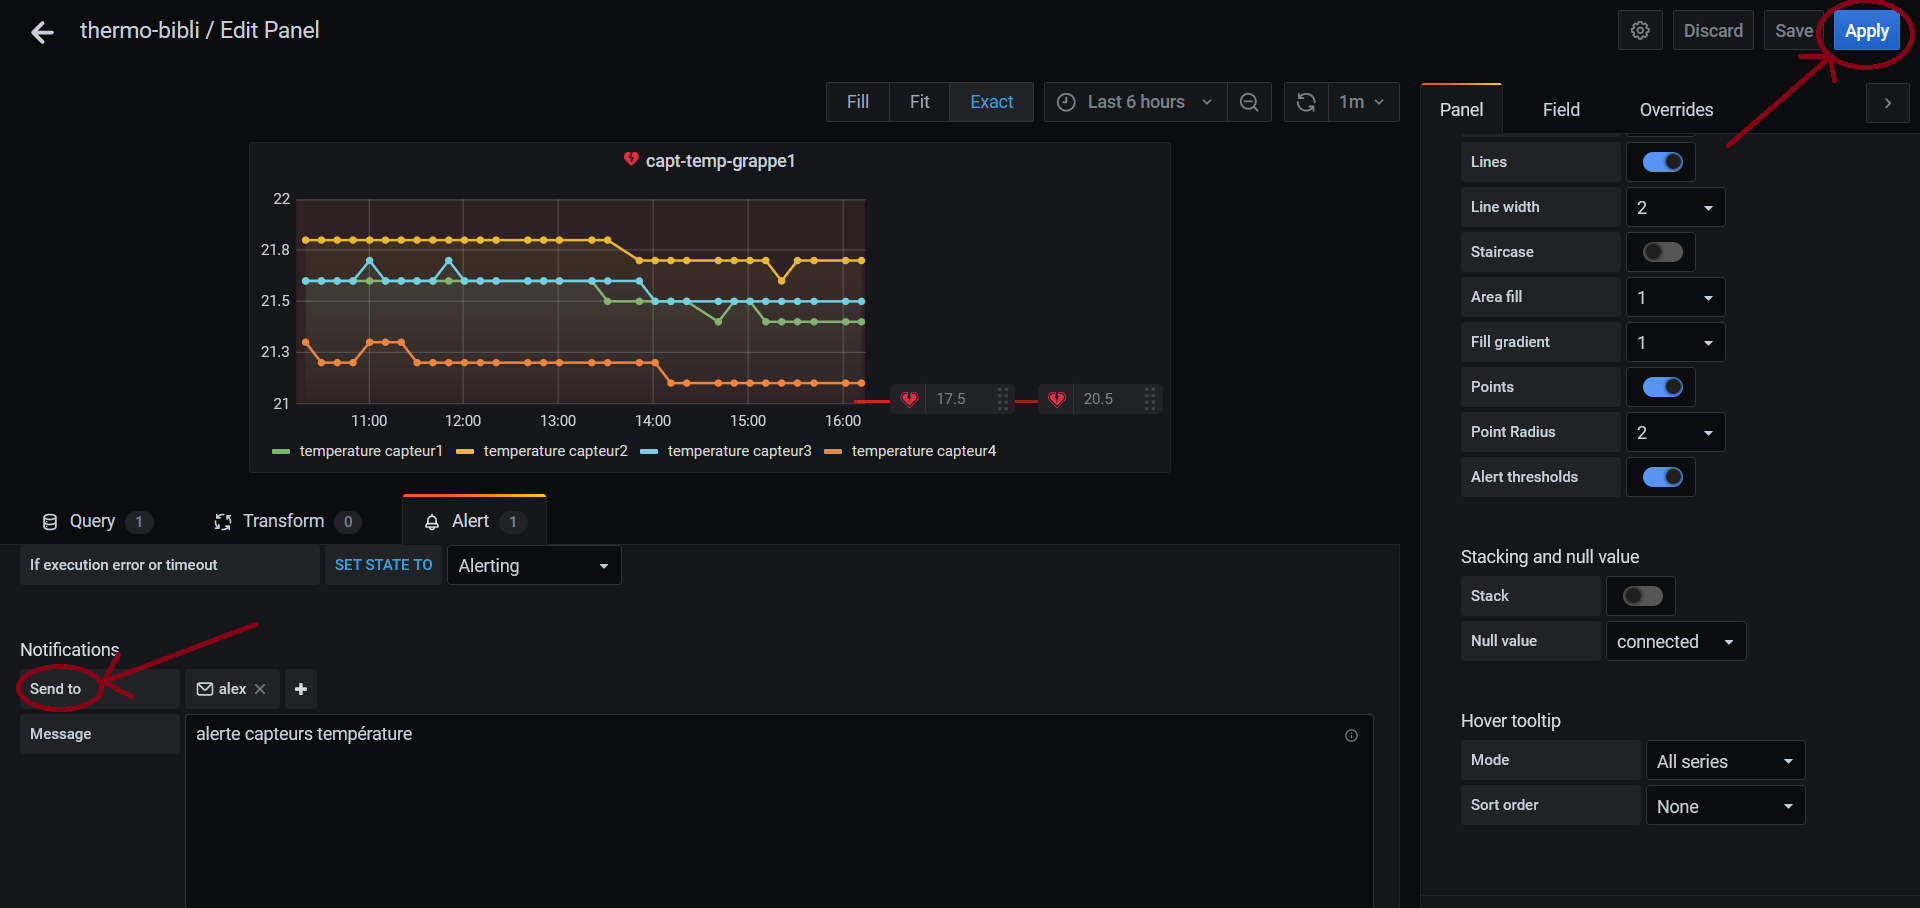
By browsing the edit panel menu, you can access “notification”.
Therfore you can select the receiver of the alert : you have to choose between different channels, if none of them are available, it will be mandatory to create a new one before this process.
You can add in the box “message” a message which will be sent along with the alert.
Don't forget to click “apply” on the top right corner, it will make you exit the edit menu.
7) Save the dashboard
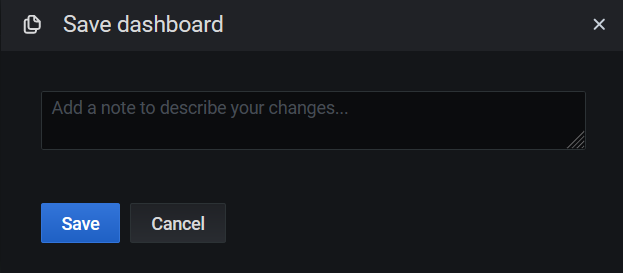
Once the alert is set , you must save the changes. To do so, click on the save icon entitled "save dashboard" on the top left corner.
Next you can add a quick description of your modifications (this is optionnal). Then click on the "save" button.
Your alarm is finally set.
Bibliography
Documentation | Grafana Labs
Grafana fundamentals | Grafana Labs
créer une alerte grafana